The 4 things NSYNC can teach you about the basics of Facebook analytics
Before we ‘digital get down’ (haha inside NSYNC joke) let me start by saying that this blog is not endorsed, or written by NSYNC. It’s written by a tragic, 90s-loving, social media fanatic.
Now that that’s out of the way, it’s time to talk stats. Before I hear you all collectively groan and switch off, it’s important to know how your marketing efforts are going and knowing how to read the stats is really important.

1. Bye Bye Bye
“I wanna to see you out that door, baby bye bye bye”
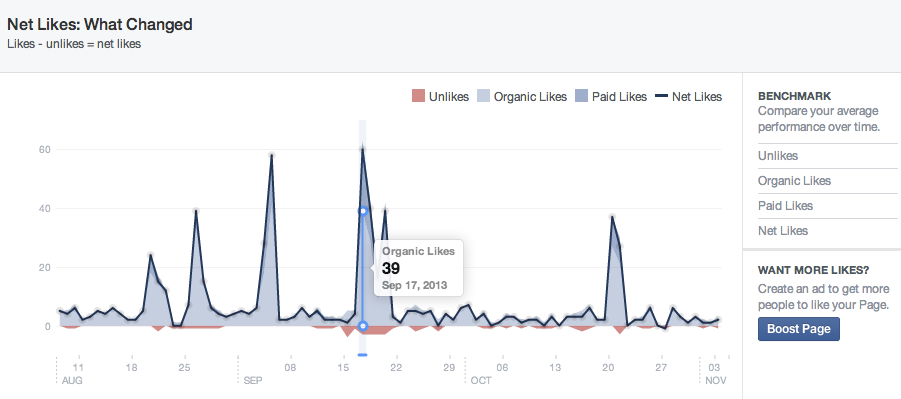
Looking at your unlikes is just as important as looking at who does like your Facebook page. Under your ‘Insights’ tab, click on your ‘likes’ tab. This tab shows you what days you gained organic likes, unlikes, paid likes and then balances them all out for your net likes. This tab will be your reality check. At the end of each week, log onto your Facebook page and have a look at your page’s growth. If on a particular day you have bulk ‘unlikes’, have a look at the post. Maybe you’re not hitting the mark for the content people want to see, or maybe you posted something controversial and people didn’t agree with you. Or maybe a whole heap of people decided to deactivate their accounts and it had nothing to do with you. But it probably does, so check it out.
2. Bringin’ da noise!
“Bring down the house!”
OK, so hopefully it’s not so much ‘noise’ as it is ‘super engaging content’ that has resulted in a large number of people loving on your content and making it spread like gastro at your town show. You need to watch your Facebook reach to find out what’s working and potentially even trends for the time of day that your fans like to consume your content. Your reach is broken down into organic (unboosted or free posts) vs your paid (advertising) posts. You can also use this tab to look at who is hiding your content from their timeline. This is one step further than unliking, their telling Facebook that they don’t want to hear from you. Ever. So this is also a great barometer to gauge your sentiment and interactions on the platform.
As a benchmark, organically, your content will reach between 4% (for run of the mill posts) to 8% (for content that is engaging), but I have seen it reach much higher than that if the content is amazing.

3. POP
“It doesn’t matter about the car I drive, or what I wear around my neck.”
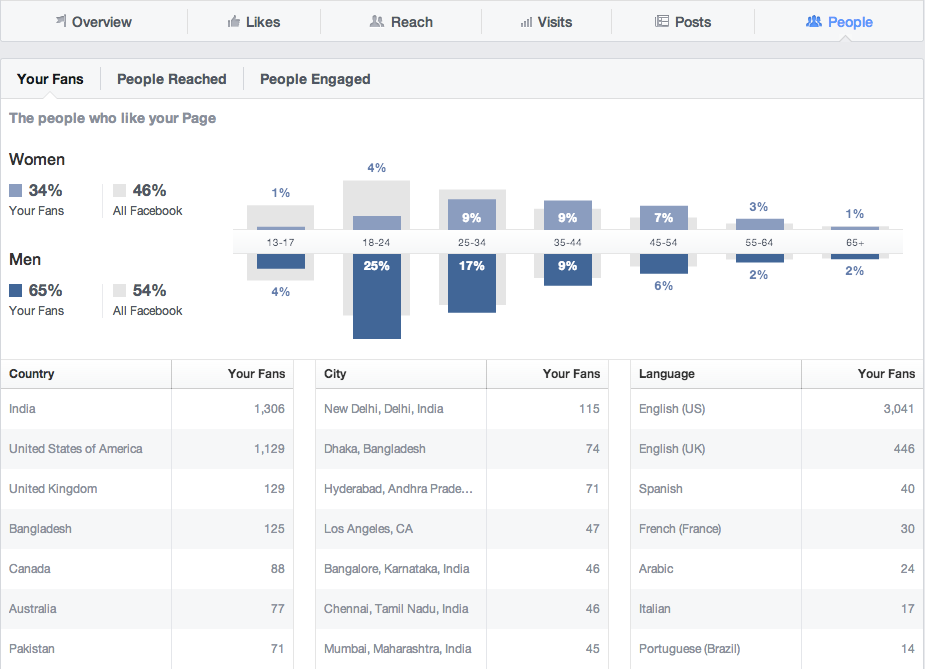
But with Facebook analytics, you can pretty much tell. The people tab is super important to watch for any shifts in demographic that may require you to update your content plan, as well as a source for finding out just who is following you. The People tab shows you the gender of your fans as well as their geographic location. Keep an eye on any trends and if you have WAY more male or female followers than the average, tailor your content, language and imagery to appeal to your market. If you want to balance this discrepancy up, don’t upset your majority fan base by posting something for the opposite sex, target it using your page’s targeting function. Use these analytics to your advantage to create content your market wants to see.
4. Space Cowboy
Why-yi-yi-yippie-yi-yay-yippie-yi-yo-yippie-yi-yay
Why-yi-yi-yippie-yi-yay-yippie-yi-yo-yippie-yi-yo
This song has absolutely NOTHING to do with video, but it’s about space, which is technology, so it kind of works. You may have noticed that video uploaded straight to Facebook (not to YouTube and shared) is gaining a lot of momentum and you may see a higher than average organic reach by creating a short video. What you may not have realised is that Facebook has recently created video insights. Click the video insights tab to see your most watched videos and how many times your videos were watched.

So there you have it, NSYNC (I mean Bekki’s) basic Facebook analytics.
How comfortable do you feel with understanding your Facebook audience and what they like to see?
Thanks Bek. Really appreciate your advice and the blog is great! I’m following you now so should get any new blogs that come up. Have a nice weekend 🙂
Best wishes, Nancy
cr nancy Sommerfield 0419 789 142
LikeLike